100,000 Stars is an interactive visualization of the stellar neighborhood. It shows the location of 119,617 nearby stars derived from multiple sources, including the 1989 Hipparcos mission. Zooming in reveals 87 individually identified stars and our solar system. The galaxy view is an artist's rendition based on NGC 1232, a spiral galaxy like the Milky Way.
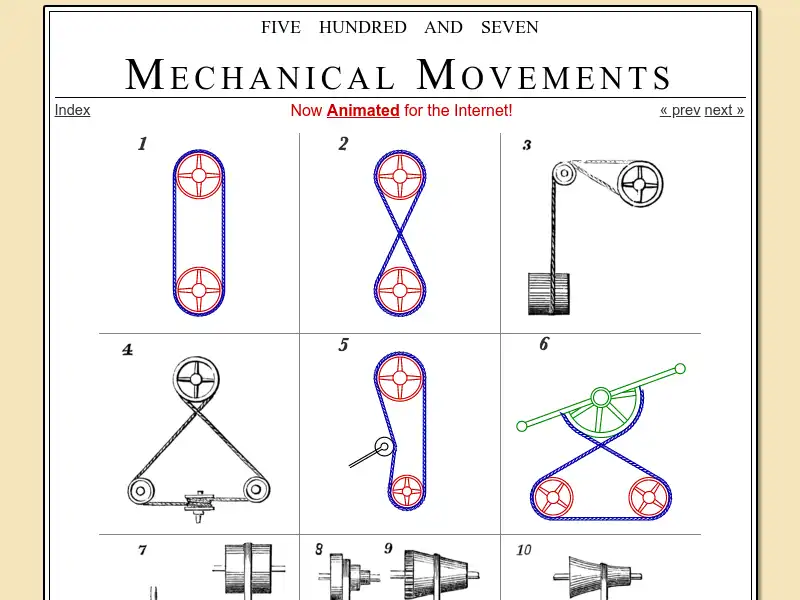
This is an online edition of the classic technical reference Five Hundred and Seven Mechanical Movements by Henry T. Brown. This site contains the original illustrations and text from the 21st edition of the book, published in 1908. It also includes animated versions of the illustrations, and occasional notes by the webmaster.
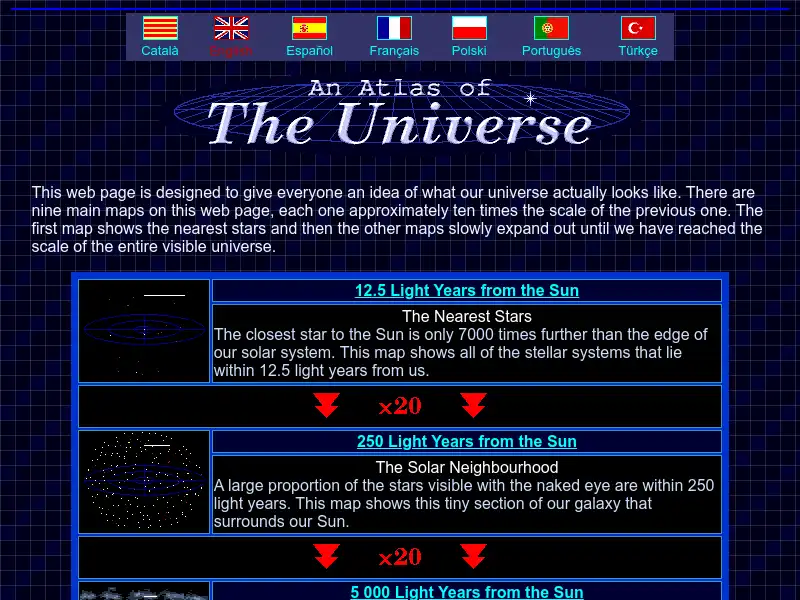
An Atlas of The Universe contains maps of the universe zooming out from the nearest stars to the entire visible universe.

I grew up taking things apart, as kids do. I've always loved cross-section books like Stephen Biesty's works. I believe there's plenty of room online for smart, high-end content that can showcase a brand's best side without feeling like marketing. We have to give to receive.
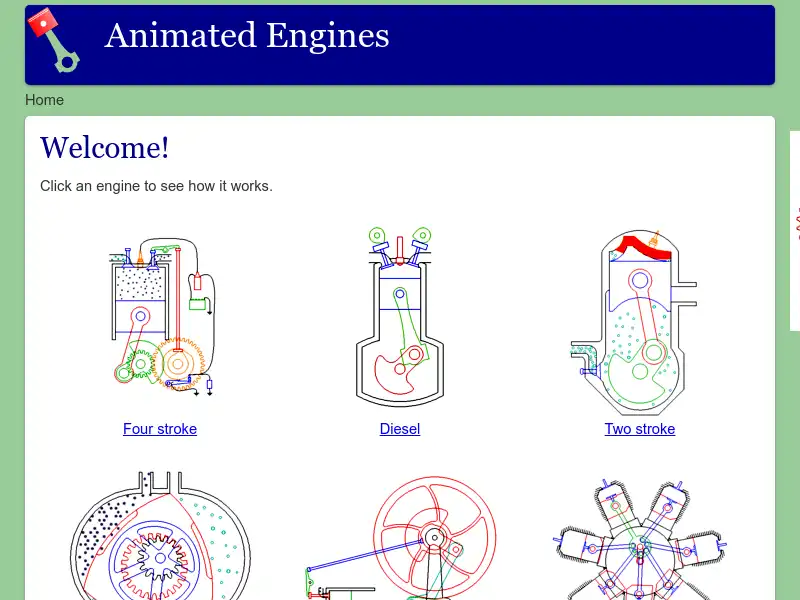
Animated Engines host animated illustrations that explain the inner workings of a variety of steam, Stirling, and internal combustion engines.
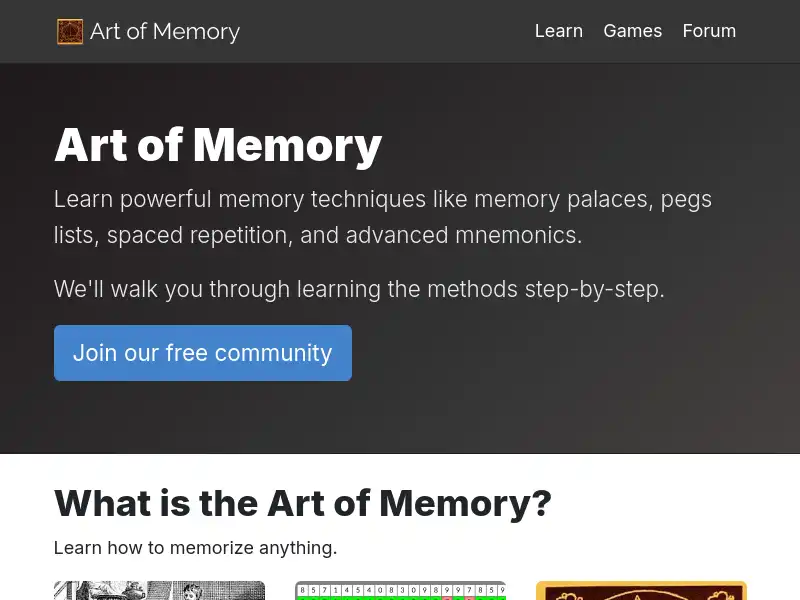
Learn powerful memory techniques like memory palaces, pegs lists, spaced repetition, and advanced mnemonics.
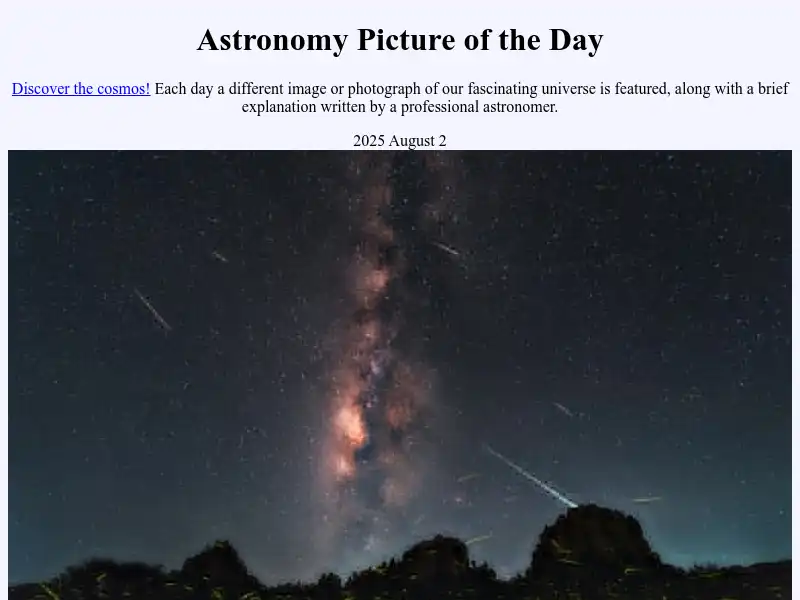
A different astronomy and space science related image is featured each day, along with a brief explanation.
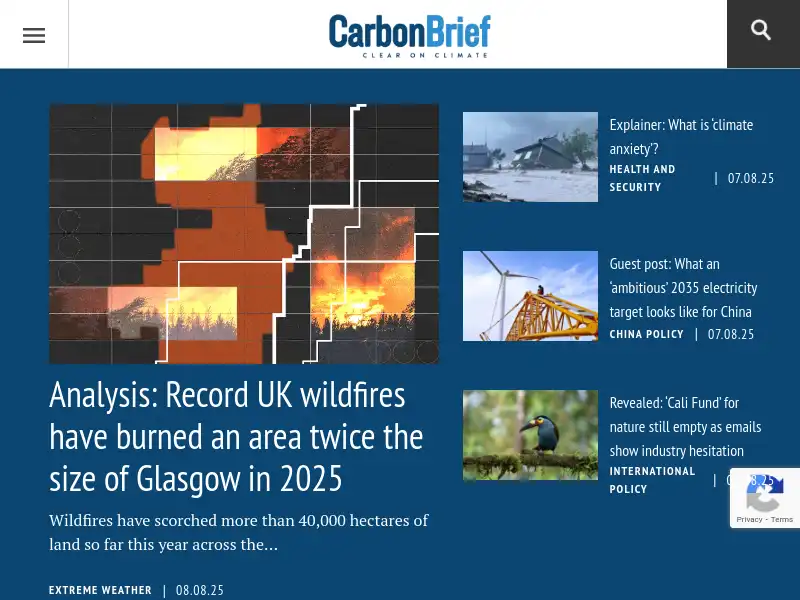
Carbon Brief covers climate science, energy and policy, specialising in clear, data-driven articles to improve the understanding of climate change.
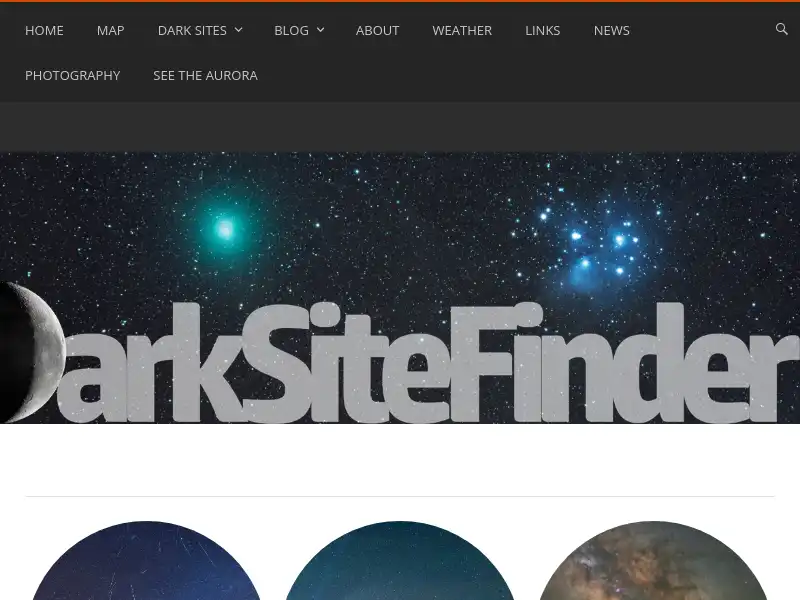
This website was created not only to help people find the few dark skies left, but also to raise awareness of the problem. It’s hard to know what you’re missing out on until you’ve seen it for yourself. In some ways light pollution is easy to fix, because there is nothing permanent about it. Unlike other forms of pollution, it does not remain in the environment once it’s shut off.
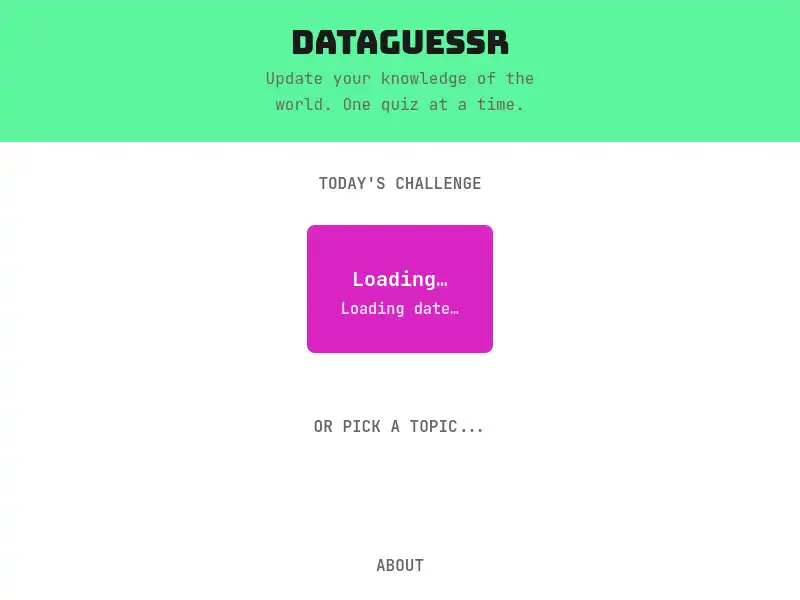
This game is inspired by the work of Gapminder and Our World in Data. It uses data to give you a better understanding of the state of the world. To borrow from Our World in Data's mission: To make progress towards a better future, we need to understand what's already working and where further action is needed. This game is a playful way to learn a bit more every day.
Desmos offers free graphing, scientific, 3d, and geometry calculators used globally. We help everyone learn math, love math, and grow with math. We believe that everyone has an inner mathematician and that some people haven’t been given the opportunity, encouragement, or tools to discover theirs.
High-quality dinosaur images, facts, and fossils for kids and educators.
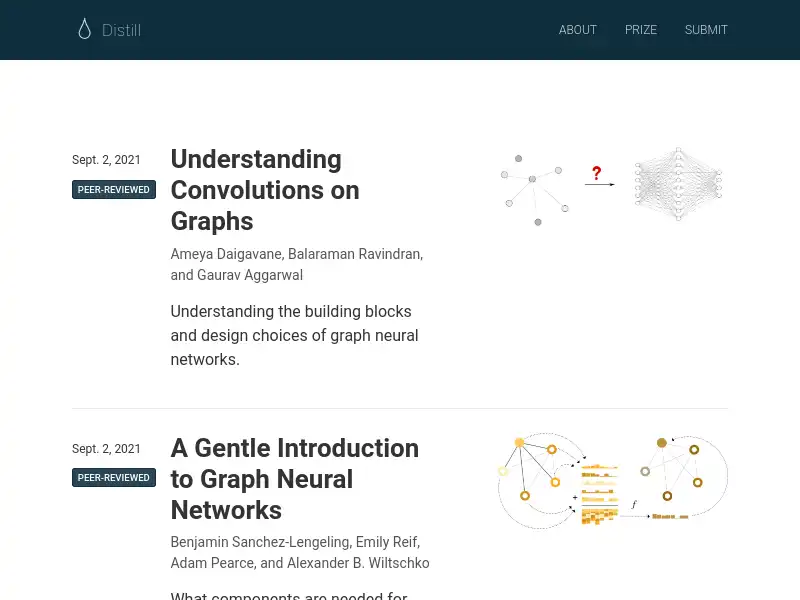
Distill is an academic journal in the area of Machine Learning. The distinguishing trait of a Distill article is outstanding communication and a dedication to human understanding. Distill articles often, but not always, use interactive media.
Email is Easy. Everyone knows what an email address is, right? Decide if each email address is valid or not.
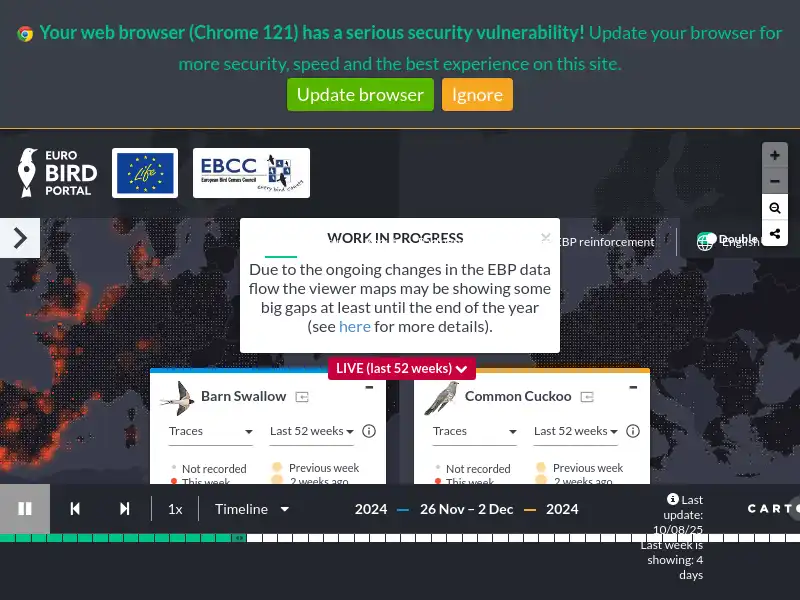
EuroBirdPortal (EBP) is an online platform and project that integrates bird observation data from various European online portals to create a large-scale, spatiotemporal database for studying bird distribution and movements.

Explordle is a geography guessing game: watch a short video and guess the city. Play the daily challenge or explore themed maps.
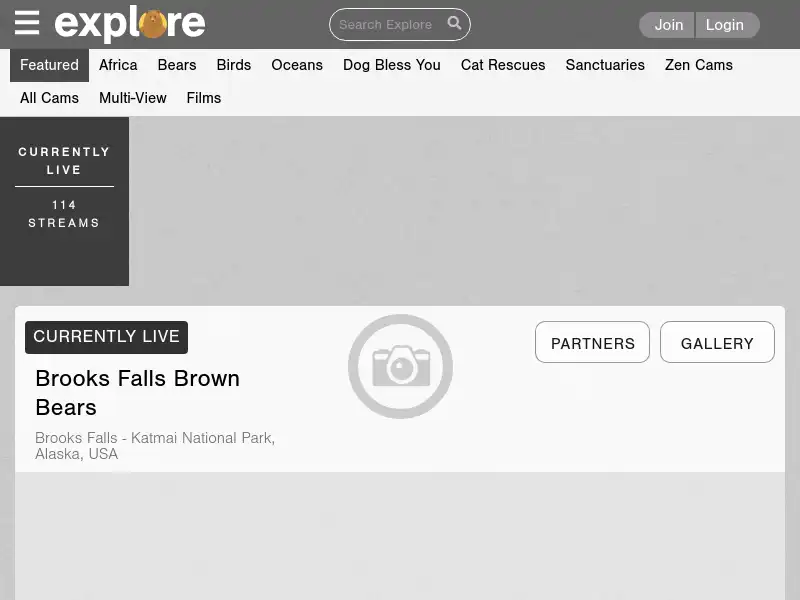
explore features a wide range of topics—from animal rights, health and human services, and poverty to the environment, education, and spirituality. Delivered in short, digestible bites, explore films appeal to viewers of all ages, from children learning about other cultures for the first time to adults looking for a fresh perspective on the world around them.
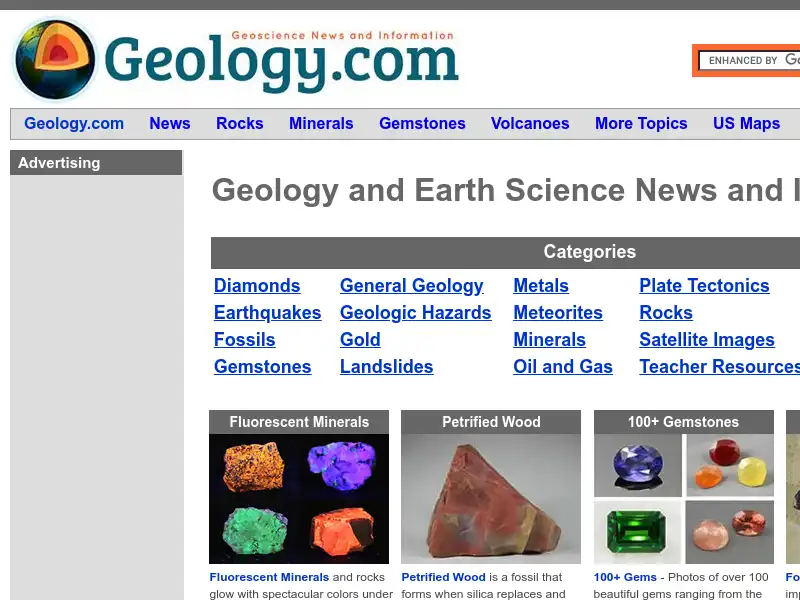
Geology.com is one of the internet’s leading websites for Earth science articles, news about geology, and geographic information. Every day thousands of people visit Geology.com to view our map collection or to read articles about rocks, minerals, gems, and many other Earth science topics.
GeoVera is an interactive platform to test and expand your knowledge of world geography. Engage in fun quizzes about countries, capitals, flags, and more!
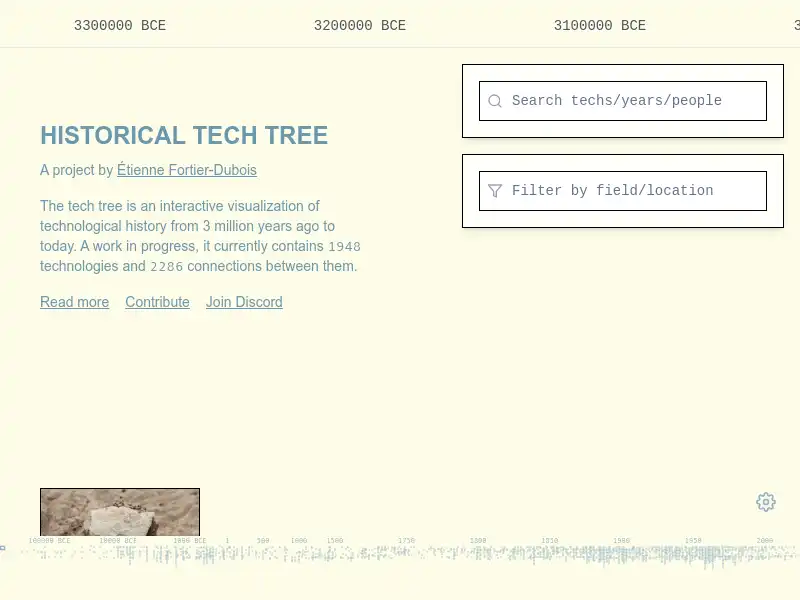
The historical tech tree is a project by Étienne Fortier-Dubois to visualize the entire history of technologies, inventions, and (some) discoveries, from prehistory to today. Unlike other visualizations of the sort, the tree emphasizes the connections between technologies: prerequisites, improvements, inspirations, and so on.
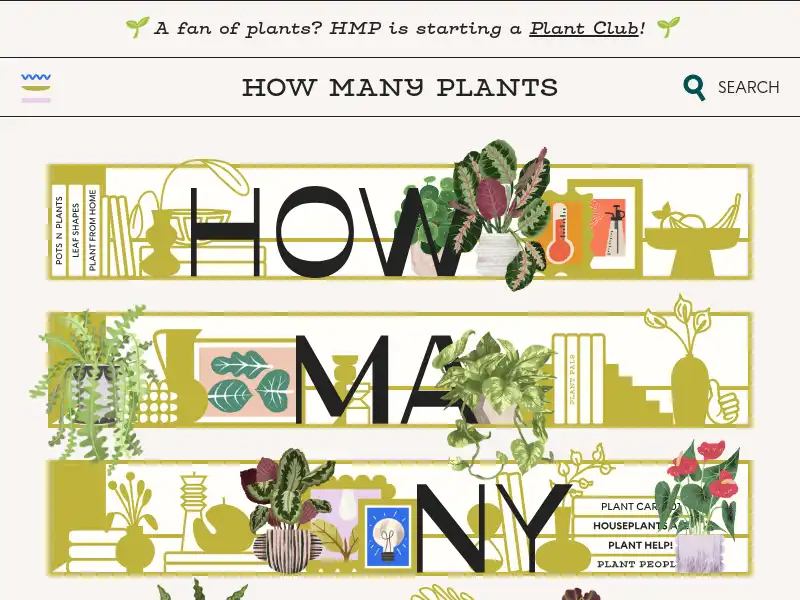
A growing resource, de-mystifying houseplant care for beginners and enthusiasts alike.
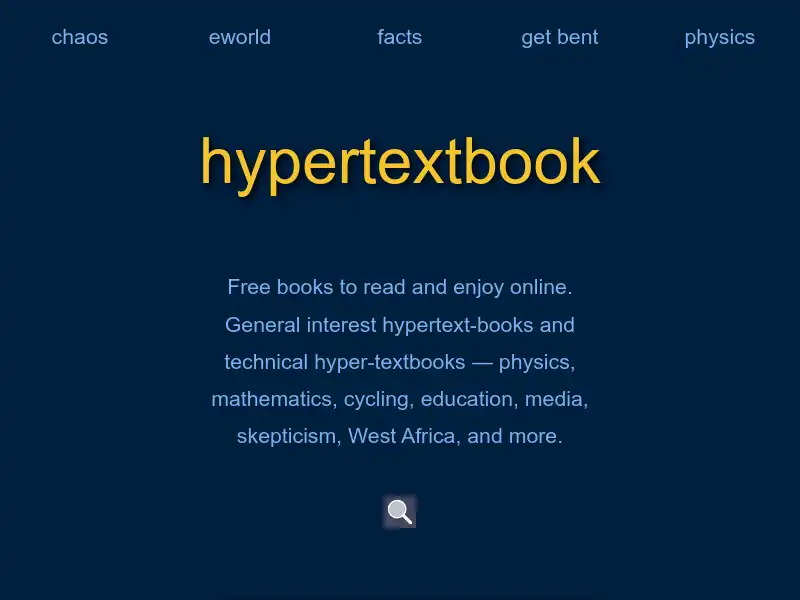
Free books to read and enjoy online. General interest hypertext-books and technical hyper-textbooks — physics, mathematics, and more.
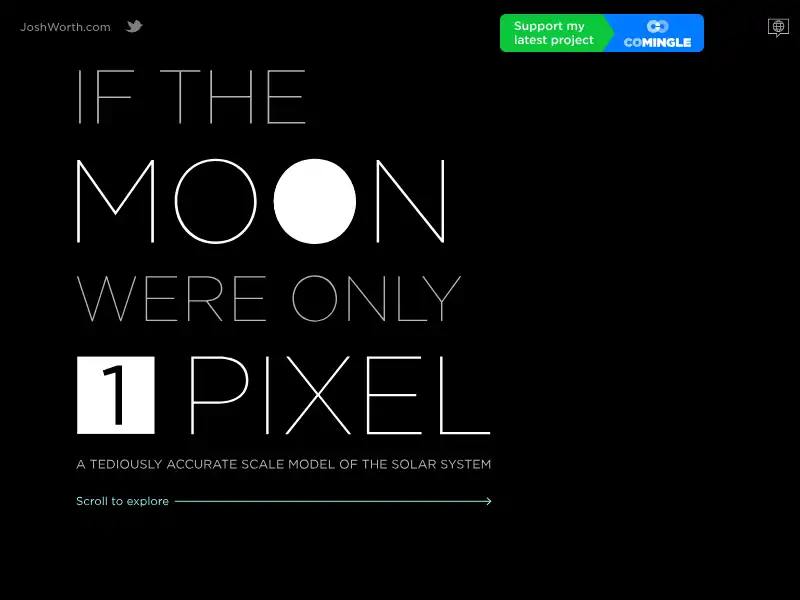
A tediously accurate scale map of the solar system that illustrates the mind-boggling amount of space between planets.
Information is Beautiful is dedicated to making sense of the world with graphics & data-visuals. We set out to explain, distil and clarify. All our visualizations are based on facts and data: constantly updated, revised and revisioned.
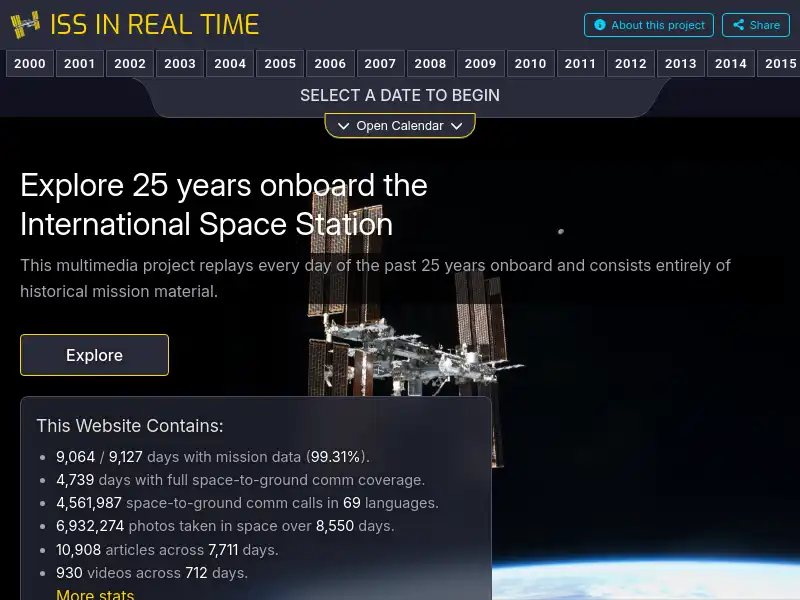
ISS in Real Time is an interactive experience that lets you explore the past 25 years onboard the International Space Station. All data on this website is original, public mission material sourced from across the internet. We have placed the data into mission context so you can experience each day as it happened.
James Webb Space Telescope Discoveries Tracker is your ultimate resource for tracking the breathtaking discoveries made by the James Webb Space Telescope in a seamless, chronological order.
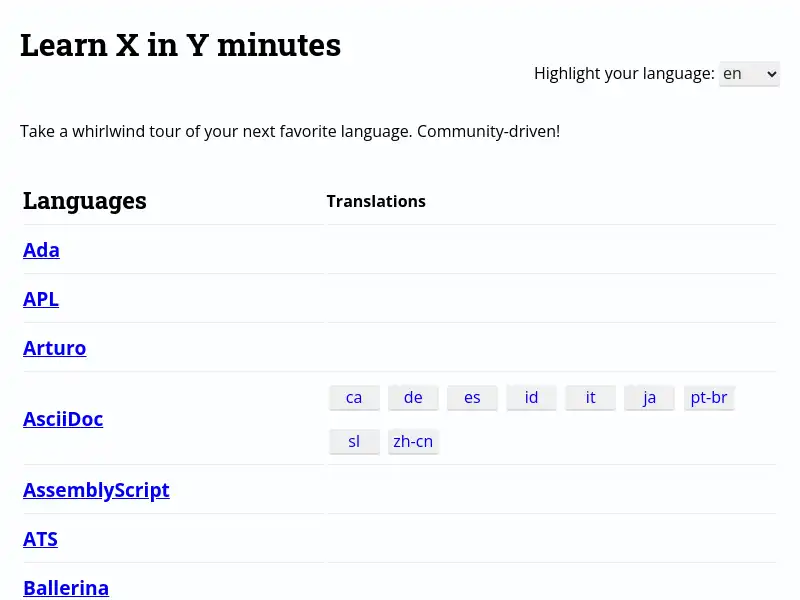
Whirlwind tours of (several, hopefully many someday) popular and ought-to-be-more-popular programming languages, presented as valid, commented code and explained as they go.
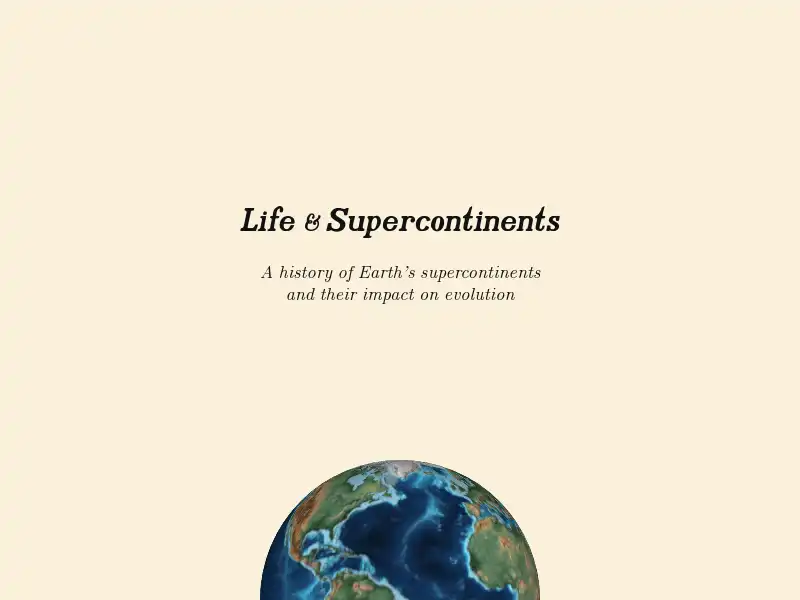
An interactive timelapse of Earth’s supercontinents and evolutionary history.
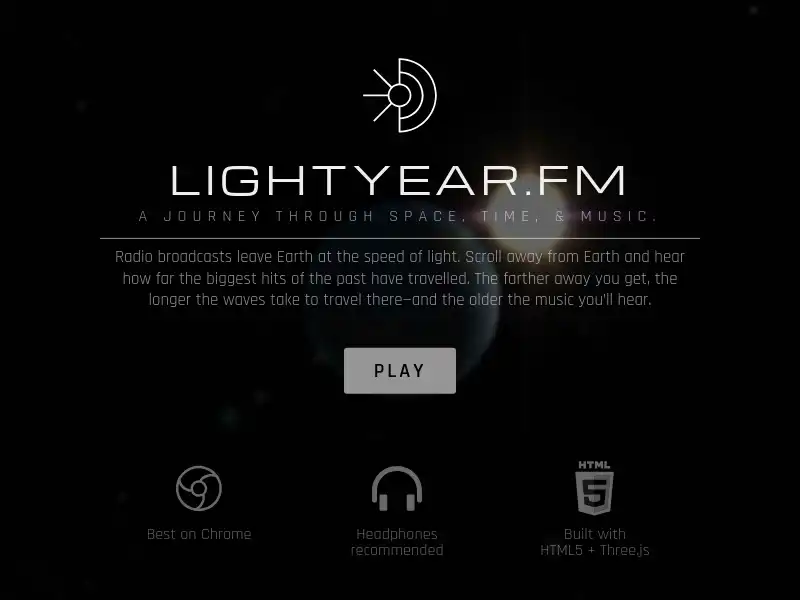
Radio broadcasts leave Earth at the speed of light and travel outwards into space. Follow them through the Milky Way as you scroll backwards through time and listen to what the stars hear.
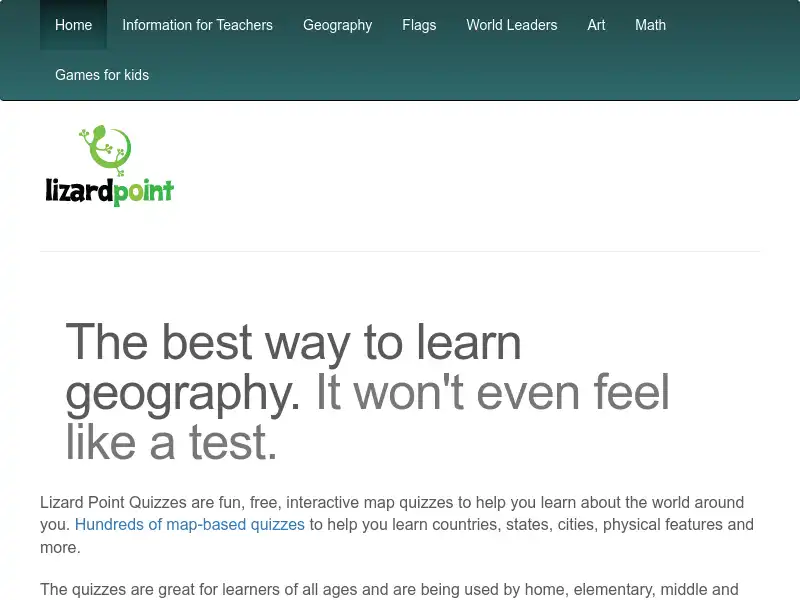
Interactive map quizzes to help you learn or study geography. Over 200 map quizzes on world countries, states, cities, rivers, flags and more.
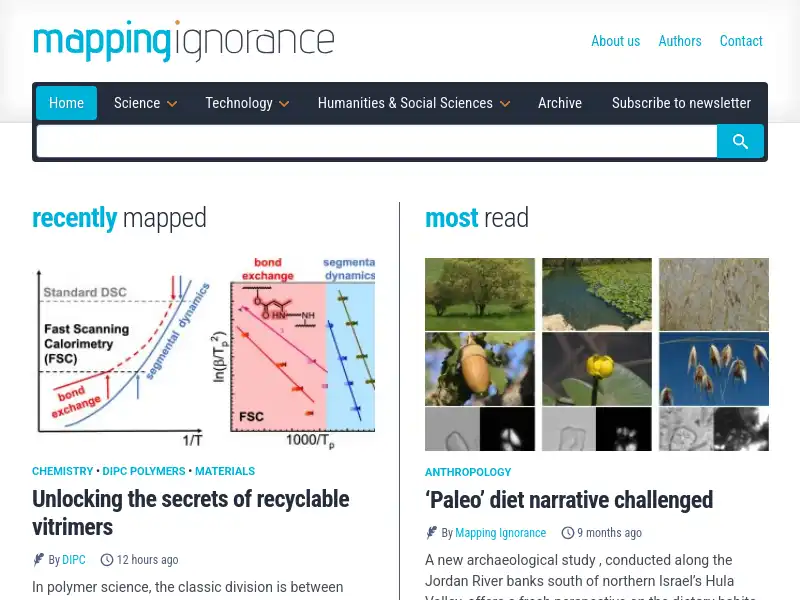
The goal of Mapping Ignorance is to spread both the latest developments in science and technology and a scientific worldview facilitating the access to it. To achieve this, Mapping Ignorance is written by specialists in each field of expertise coordinated by a dedicated editor; the aim of them all is to make sometimes abstruse but otherwise wonderful scientific and technical information enjoyable by the interested general reader.
Math Pages addresses most advanced mathematics topics. They include combinatorics, probability and statistics, number theory, geometry, calculus and differential equations, and of course, the history of mathematics.
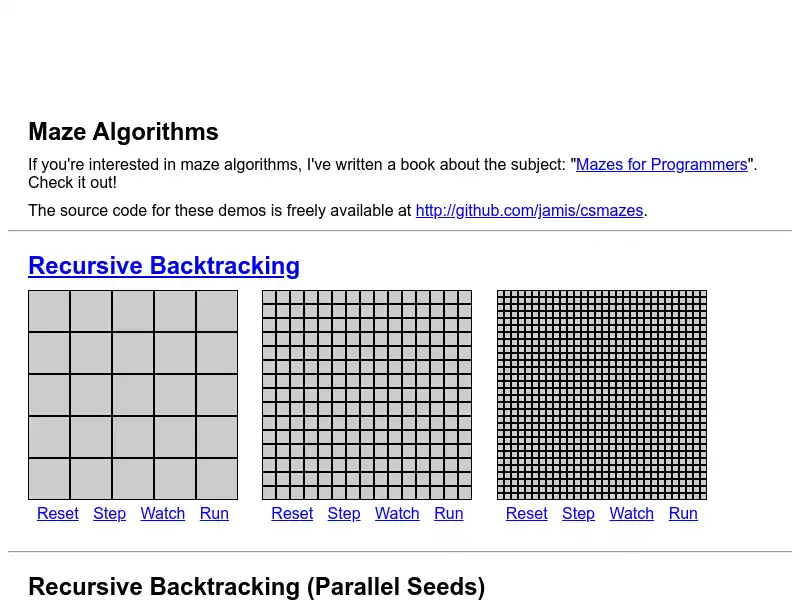
Maze Algorithms will show you how to write programs to generate, draw and solve mazes. Learn a dozen different algorithms, from the Binary Tree algorithm, to Eller's, each with different strengths and weaknesses.
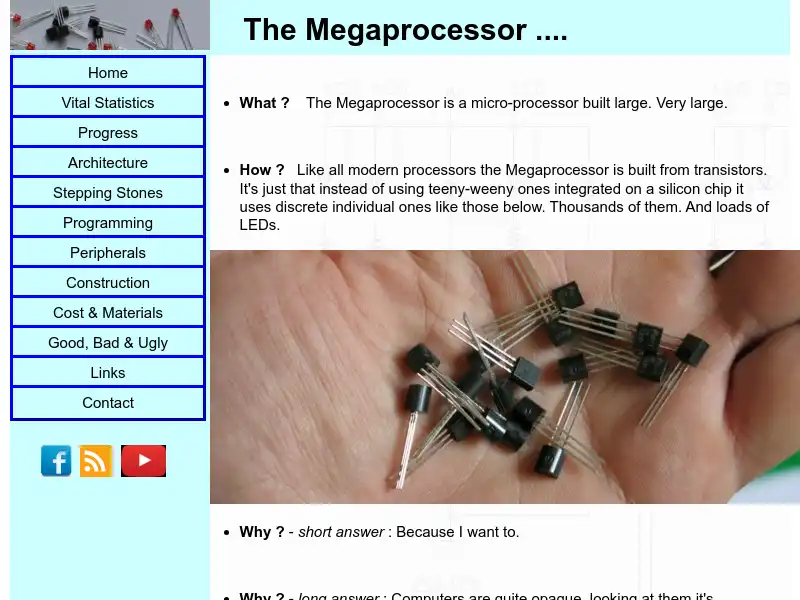
The Megaprocessor is a micro-processor built large. Very large. See and watch every detail of how computers work. And 10,000 LEDs.
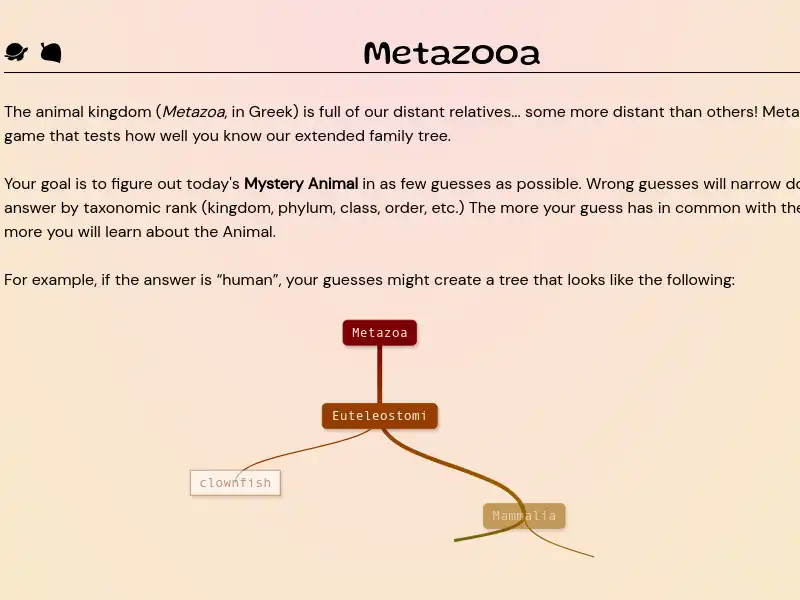
The animal kingdom (Metazoa, in Greek) is full of our distant relatives... some more distant than others! Metazooa is a game that tests how well you know our extended family tree. Your goal is to figure out today's Mystery Animal in as few guesses as possible.
In the vastness of empty space surrounding Earth, the Moon is our closest celestial neighbor. Its face, periodically filled with light and devoured by darkness, has an ever-changing, but dependable presence in our skies. In this article, we’ll learn about the Moon and its path around our planet, but to experience that journey first-hand, we have to enter the cosmos itself.
I was wondering how I can arrange objects along a spherical helix path, and read some articles on it. I ended up learning about parametric equations again, and make this visualization to document what I learned.
I’ve always been curious about how AI works. But with the constant news and updates, I often feel overwhelmed trying to keep up with it all. So I decided to go back to the basics and start learning from the beginning, with neural networks.
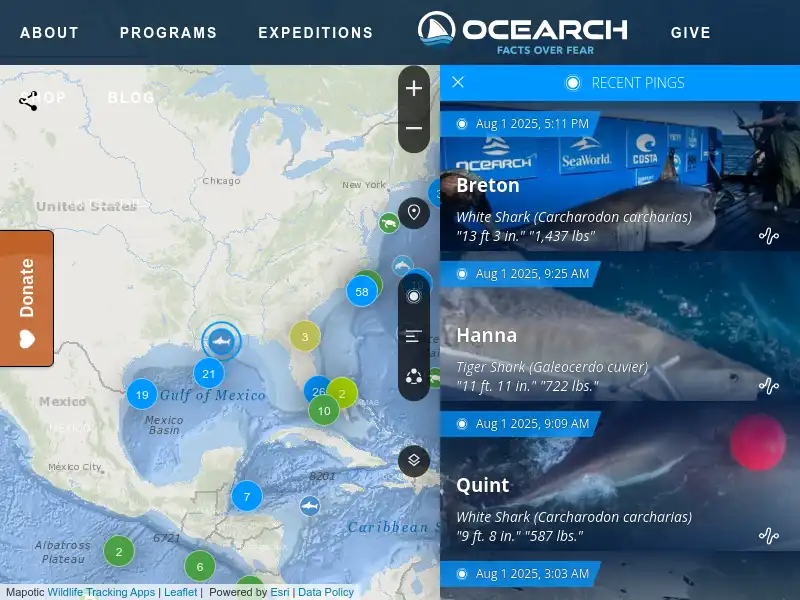
OCEARCH is a global non-profit organization conducting unprecedented research on our oceans' giants in order to help scientists collect previously unattainable data in the ocean. Our mission is to accelerate the ocean's return to balance and abundance through fearless innovations in critical scientific research, education, outreach, and policy using unique collaborations of individuals and organizations in the U.S and abroad.
OldMapsOnline is a free, open-access search portal that allows users to explore and discover historical maps from libraries and archives around the world. It brings together over 500,000 high-resolution scanned maps into a single, user-friendly interface, enabling users to search by location and time period without needing to know which institution holds the original map.
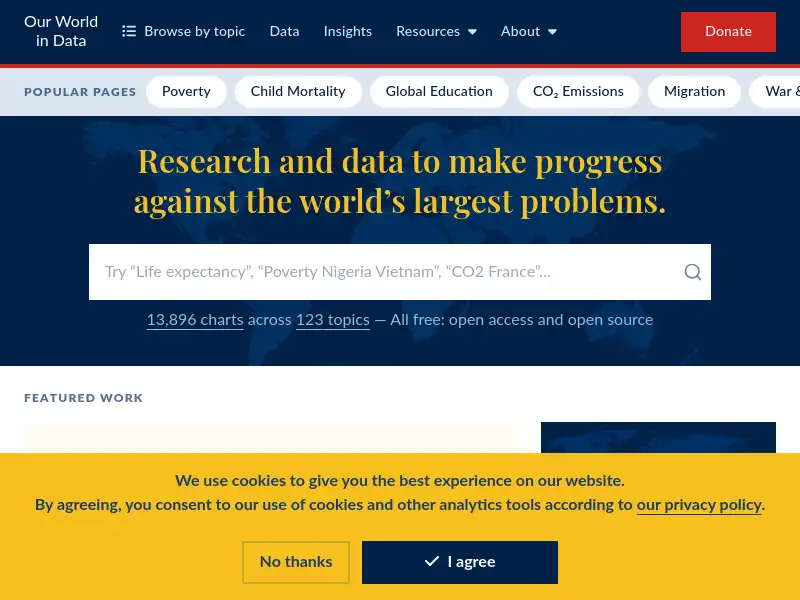
The goal of Our World In Data is to make knowledge accessible and understandable to empower those working to build a better world. As we say on our homepage, Our World in Data’s mission is to publish the ”research and data to make progress against the world’s largest problems.”
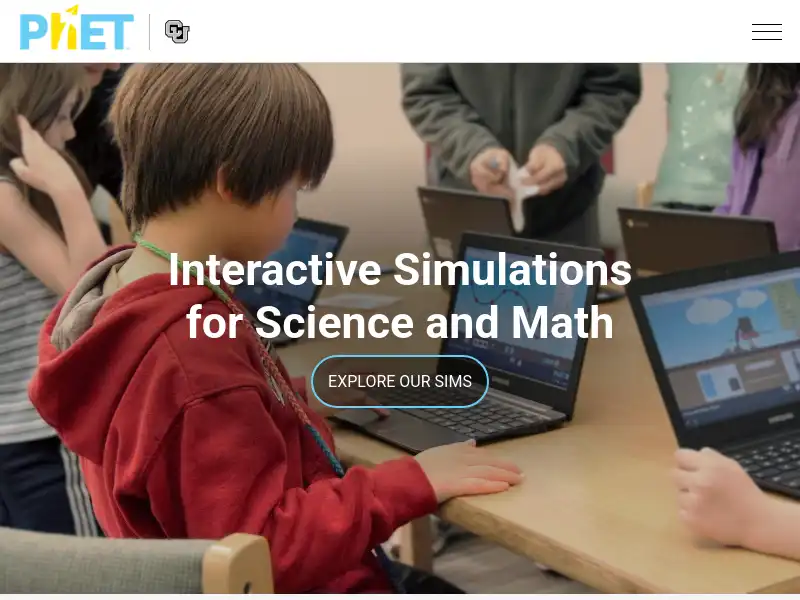
PhET provides fun, free, interactive, research-based science and mathematics simulations. We extensively test and evaluate each simulation to ensure educational effectiveness. These tests include student interviews and observation of simulation use in classrooms.
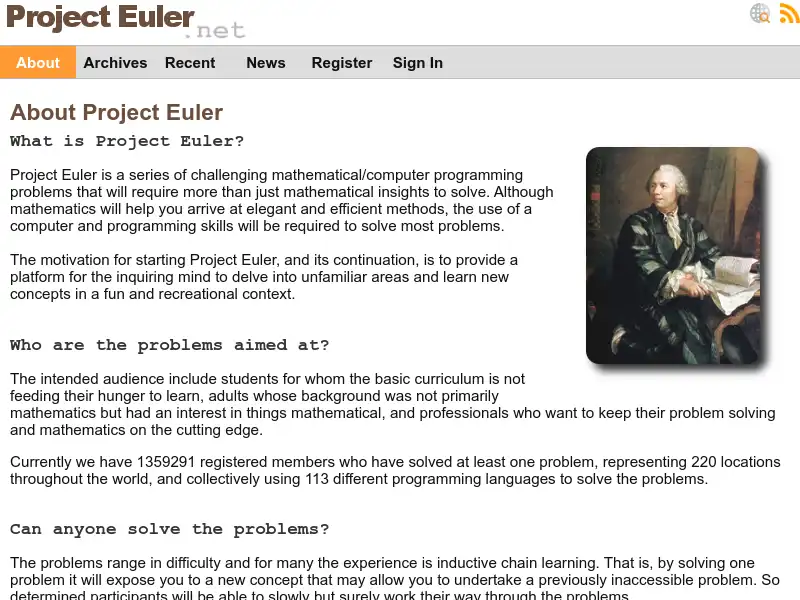
Project Euler is a series of challenging mathematical/computer programming problems that will require more than just mathematical insights to solve. Although mathematics will help you arrive at elegant and efficient methods, the use of a computer and programming skills will be required to solve most problems.
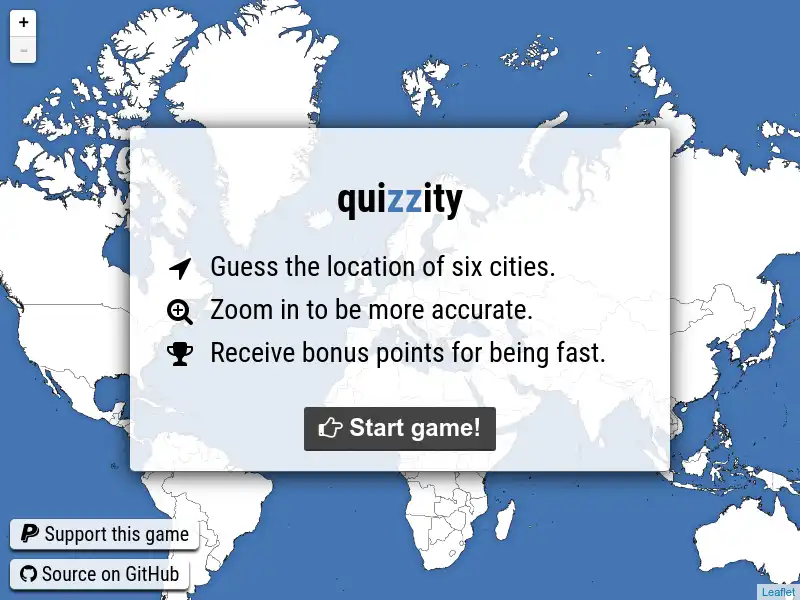
quizzity is a geographical quiz where you have to guess the location of several cities on a world map while receiving points for being both accurate and fast.
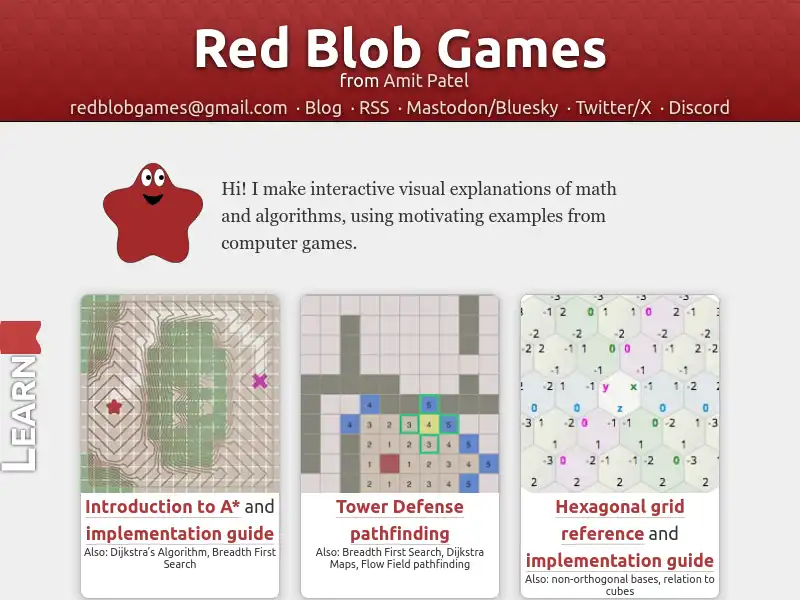
Hi! I make interactive visual explanations of math and algorithms, using motivating examples from computer games.
Restor is a network for nature positive action, providing environmental data, automated reporting, and access to funding, connecting a global movement.

This project visualizes the path of a rain droplet from any point in the world to its end point (usually an ocean or an inland water features). It will find the closest river/stream flowline coordinate to a click/search and then animate along that flowline's downstream path.
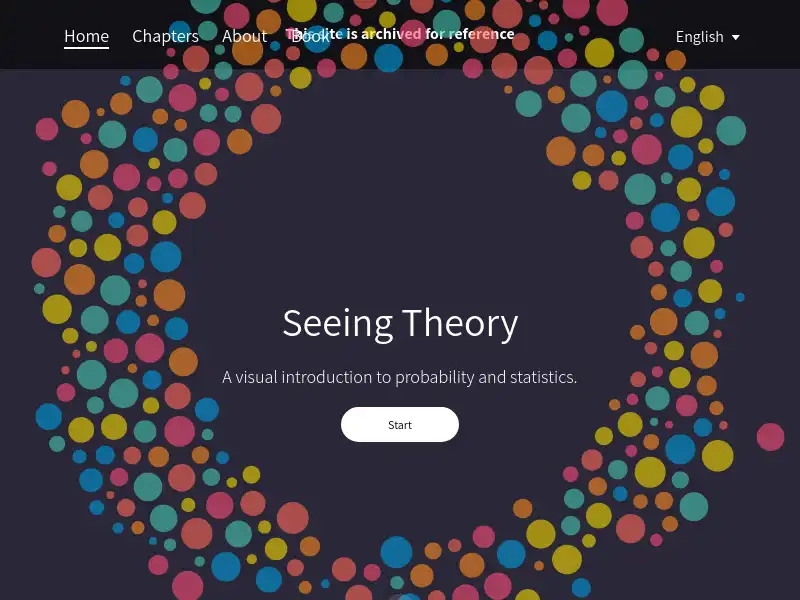
Seeing Theory was created by Daniel Kunin while an undergraduate at Brown University. The goal of this website is to make statistics more accessible through interactive visualizations.
Hundreds of fun educational games and activities for kids to play online. Topics include math, geography, animals, science and more.
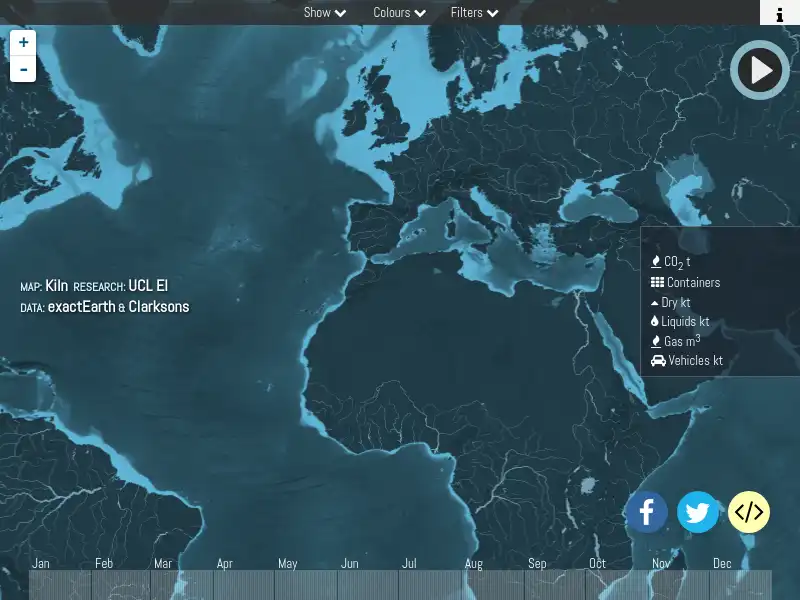
shipmap.org is a website that visualizes movements of the global merchant fleet over the course of 2012, overlaid on a bathymetric map. You can also see a few statistics such as a counter for emitted CO2 (in thousand tonnes) and maximum freight carried by represented vessels (varying units).
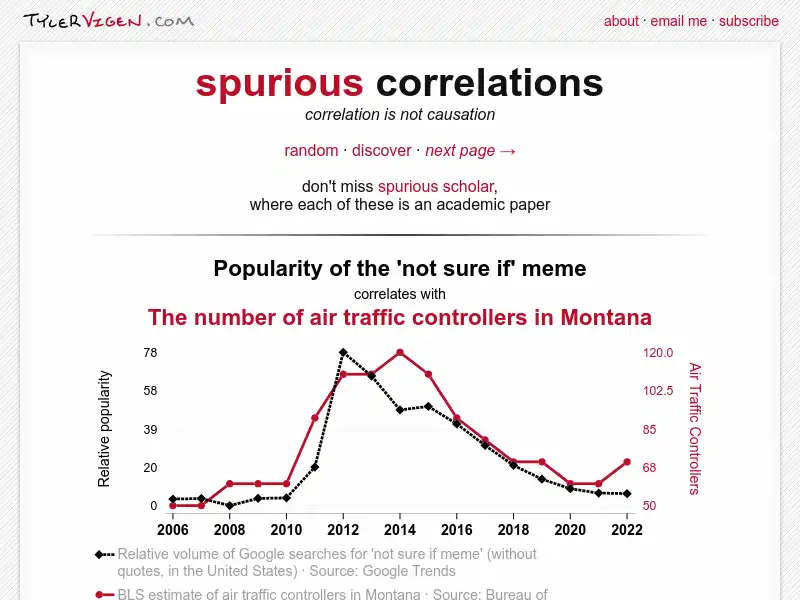
Correlation is not causation: thousands of charts of real data showing actual correlations between ridiculous variables.
The Stanford Encyclopedia of Philosophy organizes scholars from around the world in philosophy and related disciplines to create and maintain an up-to-date reference work.
Stellarium is a state-of-the-art astronomical engine providing an accurate night sky simulation based on potentially gigantic amounts of online imaging and sky objects catalogs.
Drag and drop countries around the map to compare their relative size. Is Greenland really as big as all of Africa? You may be surprised at what you find! A great tool for educators.
The World Inequality Database (WID) aims to provide open and convenient access to the most extensive available database on the historical evolution of the world distribution of income and wealth, both within countries and between countries.
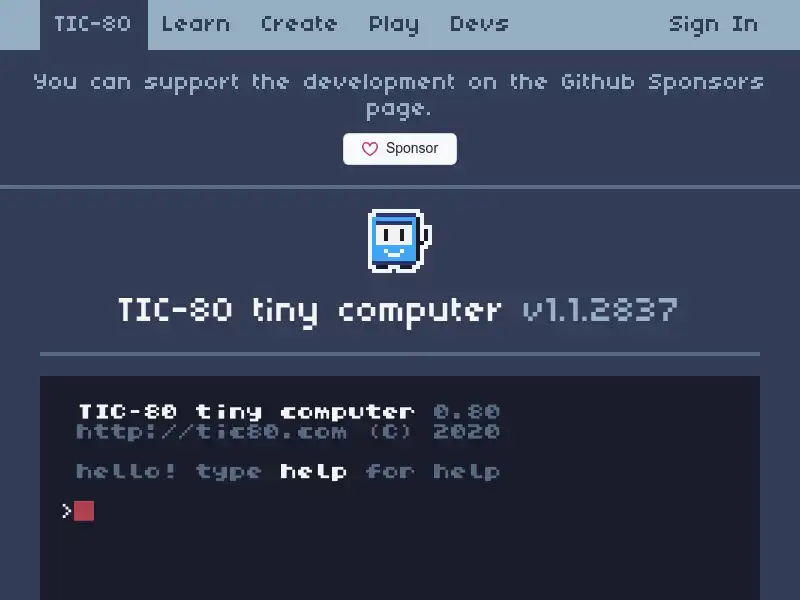
TIC-80 is a free and open source fantasy computer for making, playing and sharing tiny games. There are built-in tools for development: code, sprites, maps, sound editors and the command line, which is enough to create a mini retro game. At the exit you will get a cartridge file, which can be stored and played on the website.
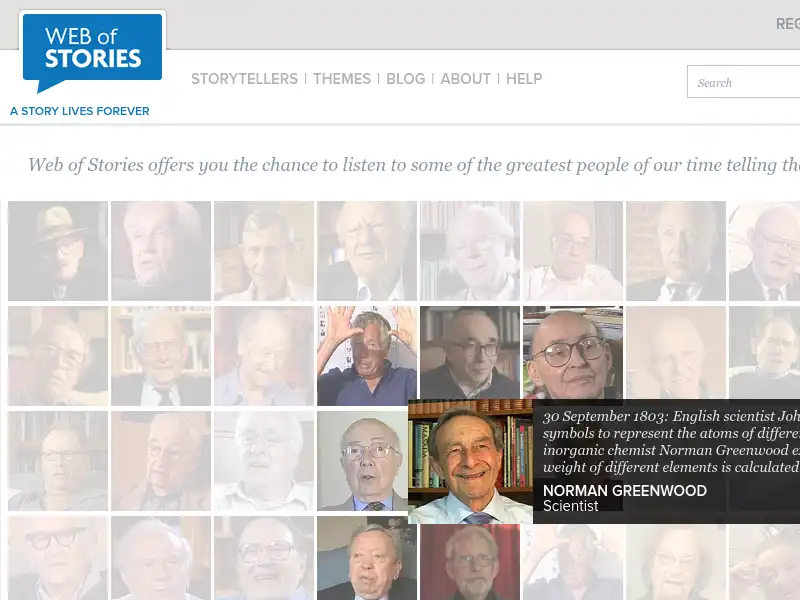
Web of Stories offers you the chance to listen to some of the greatest people of our time telling their life stories. Our aim is to provide an archive of stories from people who have influenced our world. Imagine, in a hundred years' time, future generations being able to watch people like Stan Lee, Doris Lessing or James Watson telling stories about their lives and their achievements.
We are a group of nuclear engineers hoping to help the world learn some interesting and important information about nuclear energy. We aim to enlighten the public about the capabilities of nuclear energy so that society may embrace it as an improvement in many aspects over current energy sources.
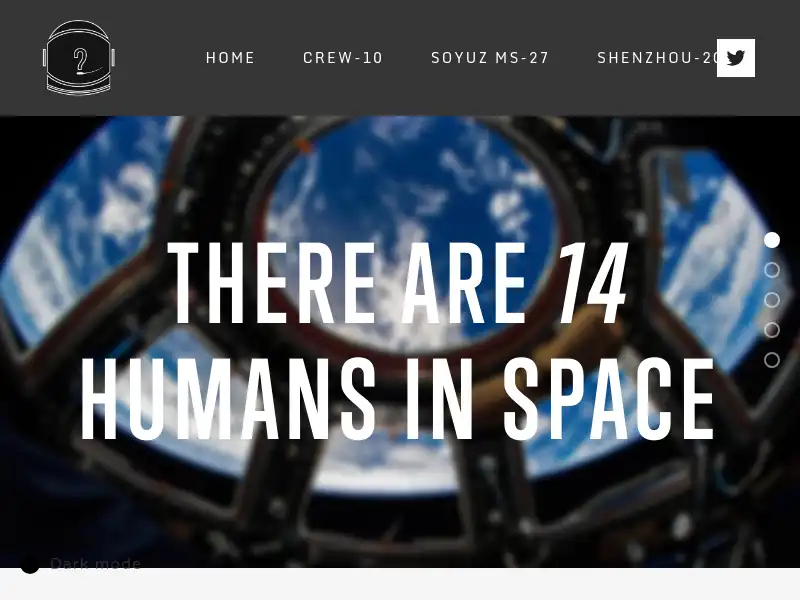
The goal of Who Is In Space is to spread the amazing actions, feats, and words of the men and women currently aboard the International Space Station. The website is constantly updated to make sure you can easily find out how many people are in space.
Words and Buttons Online is a collection of interactive tutorials, demos, and quizzes about mathematics, algorithms, and programming.
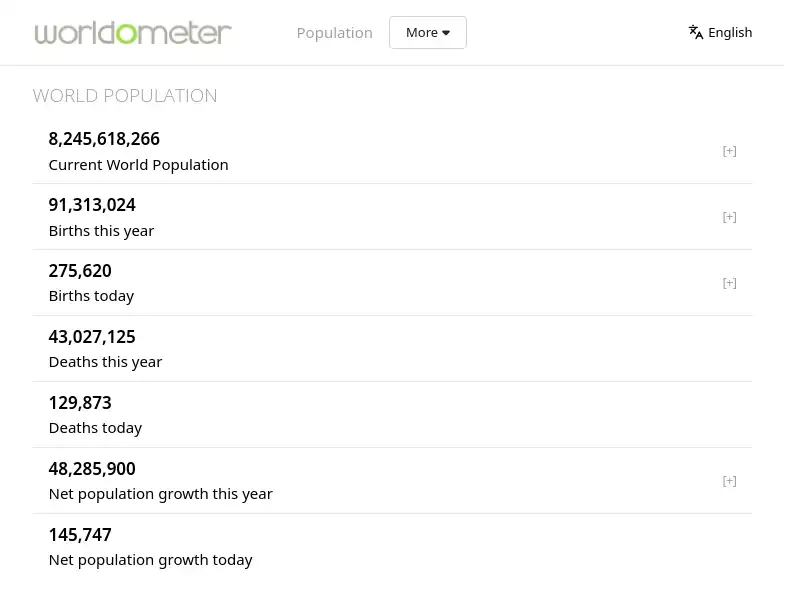
Worldometer is run by an international team of developers, researchers, and volunteers with the goal of making world statistics available in a thought-provoking and time relevant format to a wide audience around the world.
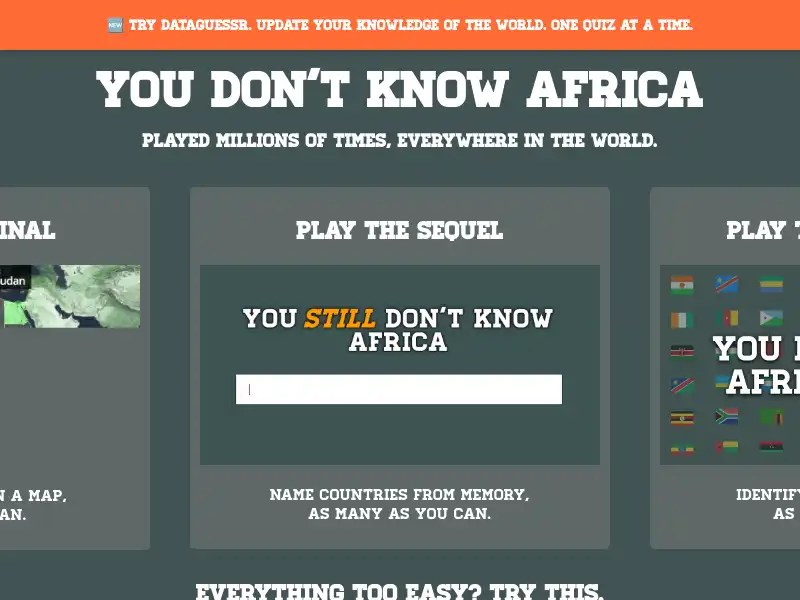
A simple hard game: how many African countries can you name from memory? Try it yourself and challenge friends.
Zoologyverse is a comprehensive portal for everything related to the fascinating world of animals, ecosystems, and the science of life. Our platform is dedicated to bringing you a universe of knowledge about zoology, wildlife, and conservation, designed for curious minds, educators, students, and nature enthusiasts.